Heap Dump Using Jhat for WebLogic Server Heap Analysis
Many times we want to Generate the Heap Dump to see what all objects are created inside the JVMs Heap space. The Heap Dump tells us that what all objects are created inside the JVM and what is the size of those Objects. Based on this analysis we can find out that what all objects (Application Objects/Platform Objects) are consuming more memory inside the heap.
Here is a Basic Step to enable the Jhat tool to generate the Heap Dump of our WebLogic Server and a brief intro of using this Great and wonderful tool.
Jhat tool comes free and available inside the “<JAVA_HOME>\bin” directory (from JDK1.6 onwards only). If you are using Jdk 1.5 or Lower version then u need to separately download the Jhat tool.from “https://hat.dev.java.net/“
Step1). Open the “startWebLogic.sh”(Unix Based OS) or “startWebLogic.cmd”(Windows OS) and then add the JAVA_OPTIONS inside it as following:
@REM **********WINDOWS Operating Systems<(startWebLogic.cmd)******************
. 1 @REM
2 @REM Call setDomainEnv here.
3 set DOMAIN_HOME=C:\bea103\user_projects\domains\WS_Security_Domain
4 for %%i in ("%DOMAIN_HOME%") do set DOMAIN_HOME=%%~fsi
5 call "%DOMAIN_HOME%\bin\setDomainEnv.cmd" %*
6 set SAVE_JAVA_OPTIONS=%JAVA_OPTIONS% -Xrunhprof:format=b,file=MyHeapDump.hprof
7 set SAVE_CLASSPATH=%CLASSPATH%
#************Unix Based Operating Systems<(startWebLogic.sh)***********
1 #
2 # Call setDomainEnv here.
3 DOMAIN_HOME="C:/bea103/user_projects/domains/WLST_Domain"
4 . ${DOMAIN_HOME}/bin/setDomainEnv.sh $*
5 SAVE_JAVA_OPTIONS="${JAVA_OPTIONS}" -Xrunhprof:format=b,file=MyHeapDump.hprof
6 SAVE_CLASSPATH="${CLASSPATH}"
Step2). Now restart Your Server. As soon as you will start your Server you will find that “MyHeapDump.hprof” file is created inside your <DOMAIN_HOME> root directory:
Step3). Open the HeapDump using the Jhat tool like following:
C:\bea103\jdk160_05\bin>jhat -J-mx1024m C:\bea103\user_projects\domains\WS_Security_Domain\MyHeapDump.hprof
OR place the file in some other location before opening it…
C:\bea103\jdk160_05\bin>jhat -J-mx1024m C:\myHeapDumps\MyHeapDump.hprof
Step4). As soon as u run the Obove command jhat tool starts a Http Server on default port 7000…Please open a browser with the following URL:
Opening Jhat Console
jhat Histogram Analysis
Jhat Object Query Language Editor
Jhat Non Product Instance Counter
Jhat Platform/Non-Platform Instance Counter
.
***** **** *** **____Advanced Jhat Analysis____ ***** **** *** **
.
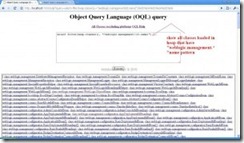
Step5). Object Query Language (OQL)
OQL is SQL-like query language to query Java heap. OQL allows to filter/select information wanted from Java heap. While pre-defined queries such as “show all instances of class X” are already supported by HAT, OQL adds more flexibility. OQL is based on JavaScript expression language.
OQL query is of the form
select <JavaScript expression to select>
[ from [instanceof] <class name> <identifier>
[ where <JavaScript boolean expression to filter> ] ]
==================================================
(OQL) Object Query Language Querie
(OQL) Object Query Language Querries
(OQL) Object Query Language Querries
(OQL) Object Query Language Querries
(OQL) Object Query Language Querries


No comments:
Post a Comment